Main Difference – Absorbance vs. Transmittance
Absorbance and transmittance are two related, but different quantities used in spectrometry. The main difference between absorbance and transmittance is that absorbance measures how much of an incident light is absorbed when it travels in a material while transmittance measures how much of the light is transmitted. Due to the way they are defined, the two are not complementary quantities: i.e., adding transmittance to absorbance directly does not give the total incident light.
As light passes through a material, it is absorbed by molecules in the material. Consequently, the intensity of light decreases exponentially with distance as the light passes through the material. Transmittance through a sample solution is is easily measured by measuring the intensities of incident and transmitted light. Using the value for transmittance, it is then possible to calculate the absorbance of the sample.
What is Transmittance?
Transmittance (


At times, this fraction may be represented as a percentage, where it is called the percentage transmittance (
What is Absorbance?
Absorbance (
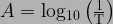
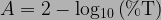
Consequently, the absorbance can also be given in terms of the percentage transmittance:
According to Beer-Lambert law, the absorbance of light, as it passes through a solution, is directly proportional to the path length of light through the material (


where 
This is an extremely useful relationship which allows concentrations of unknown solutions to be found by measuring the absorbance of light through a sample.
If we make a solution, allow light to pass through it and plot how the transmittance changes as we change the concentration of the solution (while keeping the path length travelled by light unchanged), we get an exponential relationship between transmittance and concentration:

Transmittance vs. Concentration
However, if we calculate the corresponding absorbance values and then plot a graph of absorbance vs. concentration, we will get a straight line through the origin, as predicted by the Beer-Lambert law:

Absorbance vs. Concentration
If the gradient of this graph is 

Then we can calculate the value of 
Once we have calculated
In labs, a spectrophotometer can be used to measure the absorbance of light by a sample.

A Spectrophotometer
Difference Between Absorbance and Transmittance
Definition of Absorbance and Transmittance
Transmittance:
Absorbance:
How the Value Changes as the Path Length/Concentration is Increased
Transmittance: Decreases exponentially.
Absorbance: Increases linearly.
Range
Transmittance: Values range from 0 to 1.
Absorbance: Could take values from 0 upwards.