Main Difference – Correlation vs. Regression
Correlation and regression are two methods used to investigate the relationship between variables in statistics. The main difference between correlation and regression is that correlation measures the degree to which the two variables are related, whereas regression is a method for describing the relationship between two variables. Regression also allows one to more accurately predict the value that the dependent variable would take for a given value of the independent variable.
What is Correlation
In statistics, we say there is a correlation between two variables if the two variables are related. If the relationship between the variables is a linear one, we can express the degree to which they are related using a number called Pearson’s correlation coefficient 

A value of 


Pearson’s correlation coefficient for different types of scatter plots
Pearson’s correlation coefficient for two variables 


Here, 

The terms 

Let us see how the correlation coefficient is calculated using an example. We will try to calculate the correlation coefficient for the following set of 20 values for
|
|
| -0.9557 | 0.5369 |
| -1.6441 | -0.1560 |
| 1.2254 | 1.9230 |
| 1.9062 | 1.9957 |
| 1.9679 | 2.1673 |
| -0.3469 | 0.7954 |
| -0.2328 | 0.5415 |
| 1.5064 | 1.2335 |
| 0.4278 | 0.7754 |
| -0.6359 | 0.3534 |
| 0.0061 | 0.7565 |
| 0.8407 | 1.5326 |
| 0.2713 | 1.3354 |
| 0.4664 | 1.9980 |
| -0.1813 | 1.2539 |
| 1.4384 | 2.0383 |
| 1.9001 | 2.7755 |
| 0.1022 | 0.7861 |
| 0.1251 | 0.7456 |
| -0.6314 | 0.9942 |
The values of

Looking at the equations needed to calculate the correlation coefficient, we will first calculate values for 
Next, we will calculate 

|
|
 |
 |
|
| -0.9557 | 0.5369 | -0.5131 | 1.7782 | 0.4654 |
| -1.6441 | -0.1560 | 0.2565 | 4.0881 | 1.8909 |
| 1.2254 | 1.9230 | 2.3564 | 0.7184 | 0.4955 |
| 1.9062 | 1.9957 | 3.8042 | 2.3360 | 0.6031 |
| 1.9679 | 2.1673 | 4.2650 | 2.5284 | 0.8991 |
| -0.3469 | 0.7954 | -0.2759 | 0.5252 | 0.1795 |
| -0.2328 | 0.5415 | -0.1261 | 0.3728 | 0.4592 |
| 1.5064 | 1.2335 | 1.8581 | 1.2737 | 0.0002 |
| 0.4278 | 0.7754 | 0.3317 | 0.0025 | 0.1969 |
| -0.6359 | 0.3534 | -0.2247 | 1.0276 | 0.7495 |
| 0.0061 | 0.7565 | 0.0046 | 0.1382 | 0.2140 |
| 0.8407 | 1.5326 | 1.2885 | 0.2143 | 0.0983 |
| 0.2713 | 1.3354 | 0.3623 | 0.0113 | 0.0135 |
| 0.4664 | 1.9980 | 0.9319 | 0.0079 | 0.6067 |
| -0.1813 | 1.2539 | -0.2273 | 0.3126 | 0.0012 |
| 1.4384 | 2.0383 | 2.9319 | 1.1249 | 0.6711 |
| 1.9001 | 2.7755 | 5.2737 | 2.3174 | 2.4223 |
| 0.1022 | 0.7861 | 0.0803 | 0.0760 | 0.1875 |
| 0.1251 | 0.7456 | 0.0933 | 0.0639 | 0.2242 |
| -0.6314 | 0.9942 | -0.6277 | 1.0185 | 0.0506 |
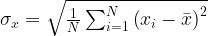
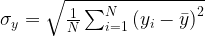
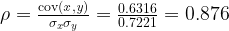
With these values, we can calculate the covariance:
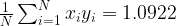


We can also calculate the standard deviations:

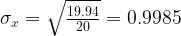

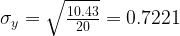
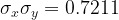
Now we can calculate the correlation coefficient:
What is Regression
Regression is a method for finding the relationship between two variables. Specifically, we will look at linear regression, which gives an equation for a “line of best fit” for a given sample of data, where two variables have a linear relationship. A straight line can be described with an equation in the form of 


Note that in these cases,


The image below shows the previous scatter plot with the line 

The data, with the best-fitting straight line obtained from regression analysis
As we mentioned before, regression analysis aids us to make predictions. For instance, if the value of the independent variable (
Difference Between Correlation and Regression
Describing Relationships
Correlation describes the degree to which two variables are related.
Regression gives a method for finding the relationship between two variables.
Making Predictions
Correlation merely describes how well two variables are related. Analysing the correlation between two variables does not improve the accuracy with which the value of the dependent variable could be predicted for a given value of the independent variable.
Regression allows us to predict values of the dependent variable for a given value of the independent variable more accurately.
Dependence Between Variables
In analysing correlation, it does not matter which variable is independent and which is independent.
In analysing regression, it is necessary to identify between the dependent and the independent variable.
Image Courtesy:
“redesign File:Correlation_examples.png using vector graphics (SVG file)” by DenisBoigelot (Own work, original uploader was Imagecreator) [CC0 1.0], via Wikimedia Commons